
blog article
Zephelin on an nRF54L: A 5× WPA3 Slowdown, Four Bugs, and What Profiling Costs
Antmicro's Zephelin profiler hit 1.0 last month. We put it on an nRF54LM20 DK running upstream Zephyr and pointed it at real problems: a WPA3-SAE commit that takes 3.3 seconds on Zephyr v4.4.1 and 650 ms with one Kconfig default restored, a stack sized 4× too large, and the question of what observing all this costs. Getting call graphs at all took four fixes, now upstream as PRs.
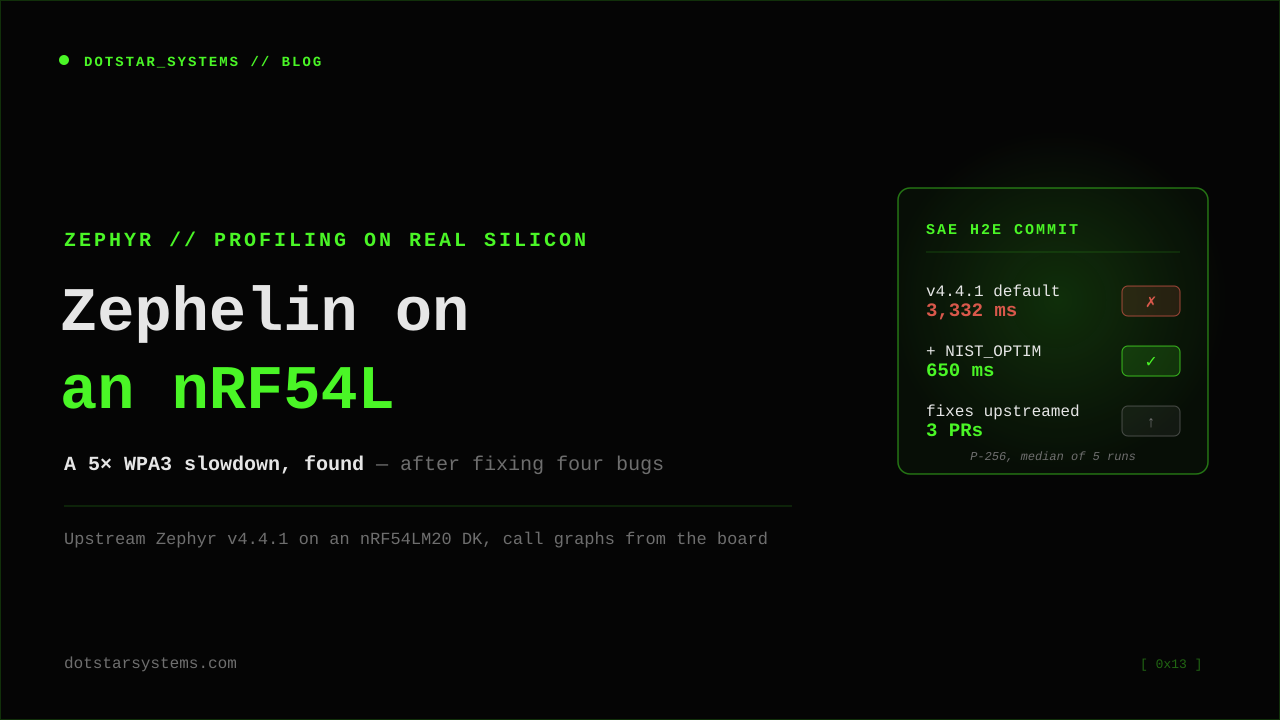
TL;DR: On Zephyr v4.4.1, generating one WPA3-SAE Hash-to-Element commit on an nRF54LM20B takes 3,332 ms. Zephelin’s call graph puts 93% of that in two elliptic-curve scalar multiplications, 1.5 seconds each, and nothing else moved when we fixed it: the cause is
MBEDTLS_ECP_NIST_OPTIMdefaulting to off in v4.4. Turned back on, the commit takes 650 ms. Getting that call graph out of a Cortex-M33 took four fixes to Zephyr’s instrumentation subsystem and Zephelin’s patches — now open as zephyr#121033, zephyr#121034 and antmicro/zephelin#10. Along the way: a main stack sized 4× too large, a heap number that’s sampled rather than peaked, and a memory profiler whose cost is almost entirely the UART it talks over.
Zephelin is Antmicro and Analog
Devices’ profiling library for Zephyr, with a browser-based
Trace Viewer
that draws flame graphs from what the board sends back. It reached 1.0 in
September. It’s pitched at AI workloads — TFLite Micro and microTVM layer
timing — but underneath it is Zephyr’s own tracing subsystem, compiler
instrumentation (-finstrument-functions), CPU-load sampling and memory
profiling, and none of that cares whether there’s a neural network involved.
None of its examples are Nordic parts. So we took an nRF54LM20 DK, upstream Zephyr (no nRF Connect SDK), and three questions we’d actually want answered on a customer’s firmware:
- Where does the time go in a WPA3-SAE commit?
- Are the stacks and heaps sized from data or from fear?
- What does it cost to watch?
”Upstream” means v4.4.1 plus 37 patches
The first surprise is that Zephelin does not run on unmodified Zephyr. Its
manifest pins v4.3.0 or v4.4.1, and its trace tooling expects CTF packet
headers, 64-bit timestamps, a tracing-core transport for instrumentation and
a batch of instrumentation fixes that live as 37 patches in
zephyr/patches-releases/v4.4.1/. That’s fine for a profiling build, but
it’s worth knowing before you drop Zephelin into a product tree: you’re
profiling a patched kernel.
The rest of the bring-up was small stuff, each worth a sentence because each fails quietly:
- The memory profiler stays off without a warning unless
CONFIG_SYS_HEAP_ARRAY_SIZEis non-zero. - The profiler and tracing threads run at low priority. SAE spends seconds in
mainwithout yielding, so the trace buffer overflows and events vanish. The samplers need cooperative priority and tracing needs to be synchronous — which, as we’ll see, has a price. west zpl-prepare-tracedrops Zephyr’s named events on the way to the Trace Viewer format, so the cycle counts we emitted from the app had to be read back out of the raw CTF.
1. Where an SAE commit spends its time
The workload is hostap’s own SAE code, called directly: derive the password element and build a commit for group 19 (P-256), both ways WPA3 allows — Hash-to-Element, which is what you should be using (here’s why), and Hunting-and-Pecking with hostap’s 40-iteration padding. The harness first reproduces the IEEE 802.11-2020 Annex J.10 test vector and refuses to report timing from code that computes the wrong point.
On Zephyr v4.4.1, five runs each:
| P-256, median of 5 | v4.4.1 default | MBEDTLS_ECP_NIST_OPTIM=y | |
|---|---|---|---|
| H2E commit | 3,332 ms | 650 ms | 5.1× |
| Hunting-and-Pecking commit (k=40) | 2,174 ms | 859 ms | 2.5× |
| Flash | 338,068 B | 339,044 B | +976 B |
If 3.3 seconds sounds wrong for one commit on a 128 MHz Cortex-M33, it is. The same harness on a recent Zephyr main generates the same commit in about 625 ms. And note the ordering: on stock v4.4.1, H2E looks 53% slower than padded Hunting-and-Pecking. A team benchmarking there would reasonably conclude that the secure option is too expensive for their part. It isn’t — that conclusion is an artefact of a Kconfig default.
Here is the capture in Zephelin’s Trace Viewer, instrumenting hostap and
leaving the crypto library as a black box underneath it. One H2E commit, then
one Hunting-and-Pecking commit, with crypto_ec_point_mul selected:
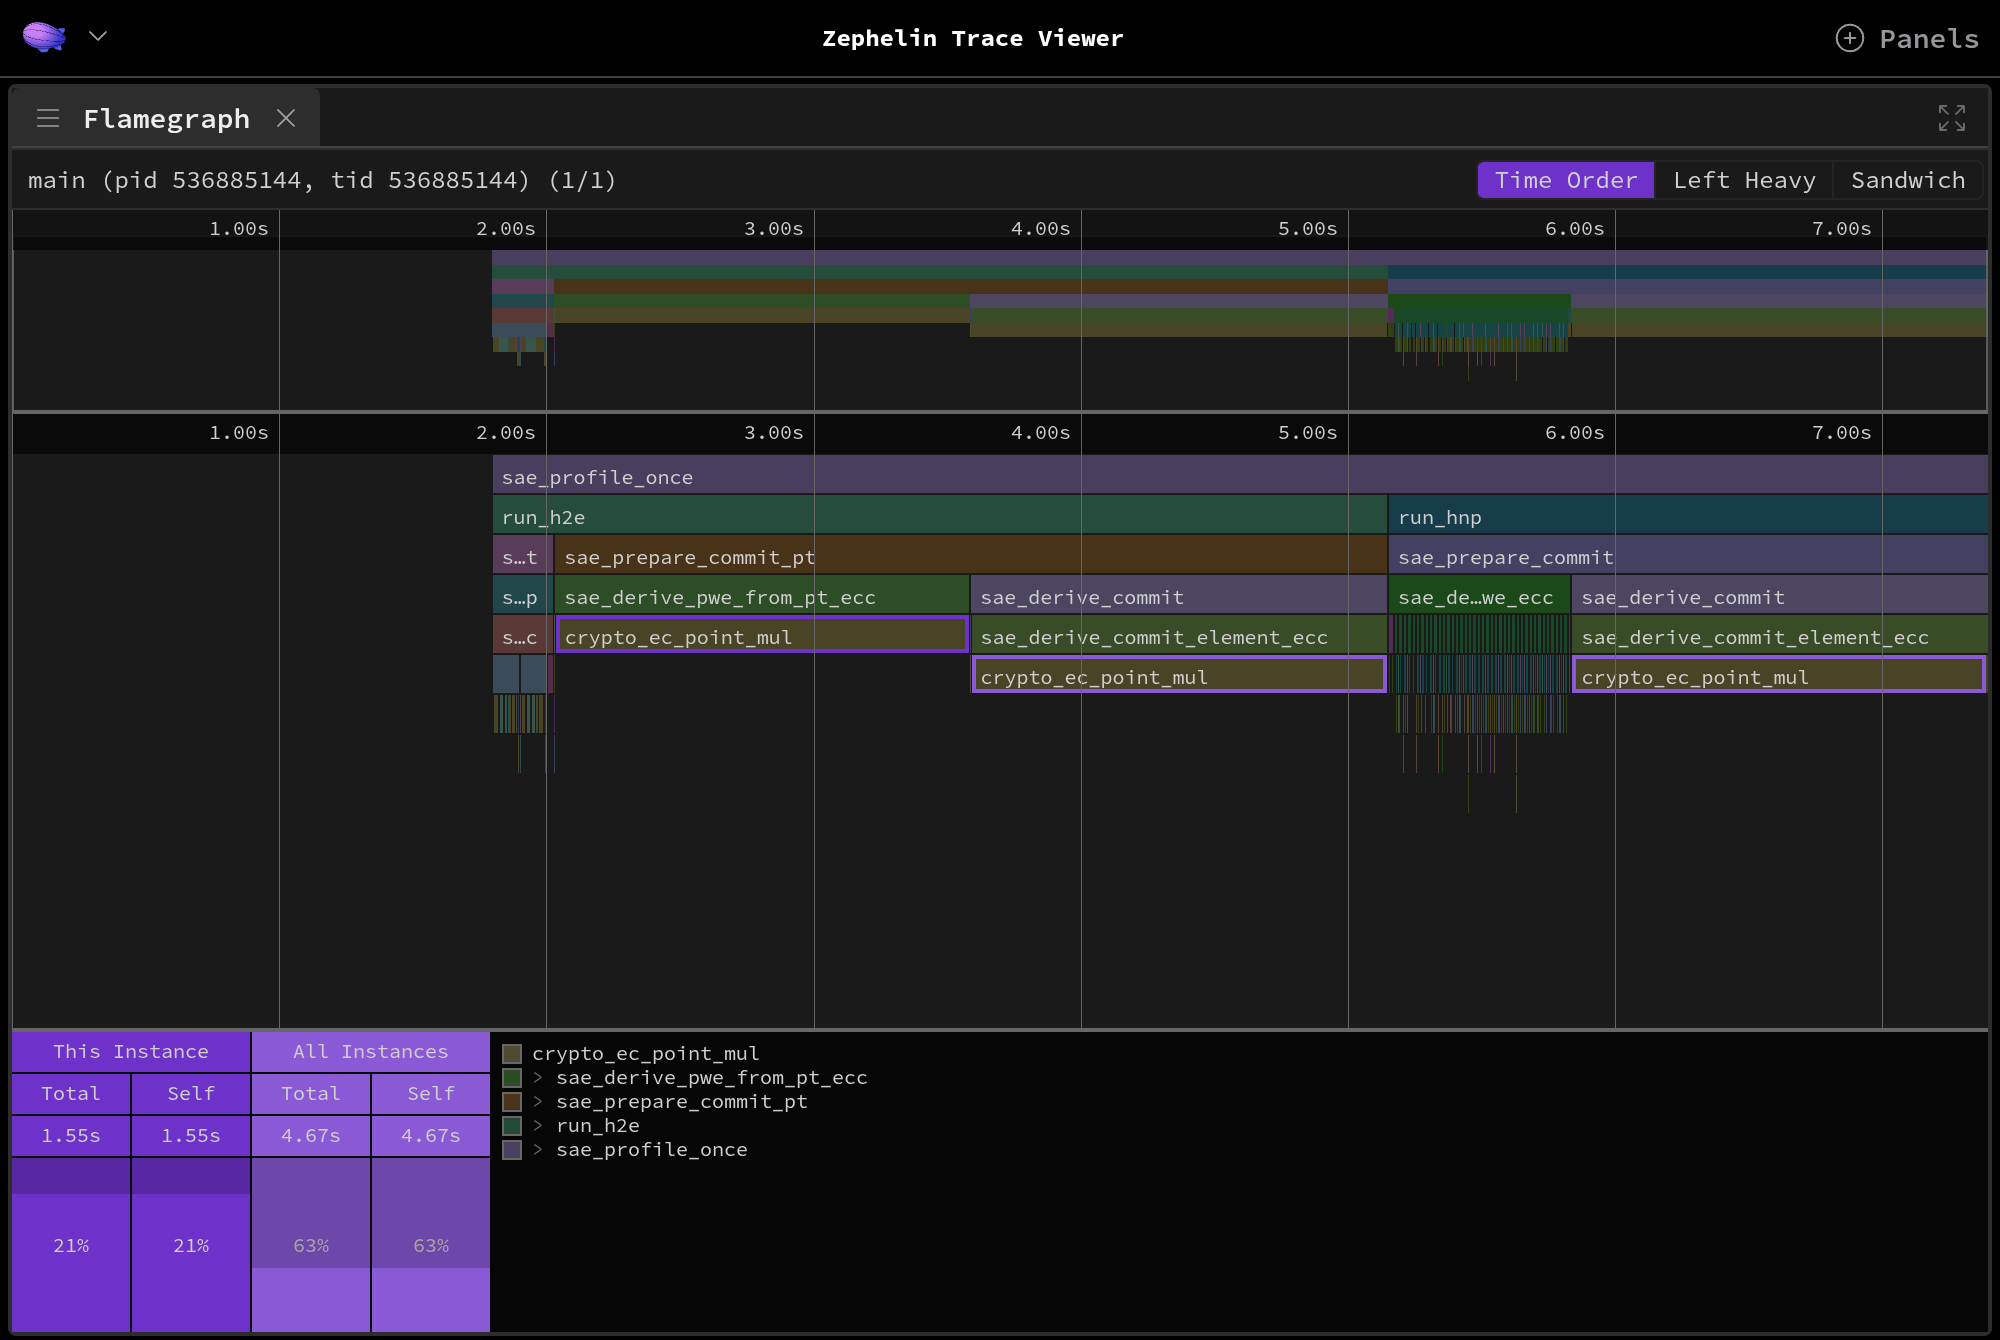
Three scalar multiplications — two in the H2E commit, one in
Hunting-and-Pecking — and they are the timeline: 1.55 s each, 4.67 s
between them. Here is the same capture with MBEDTLS_ECP_NIST_OPTIM turned
on:
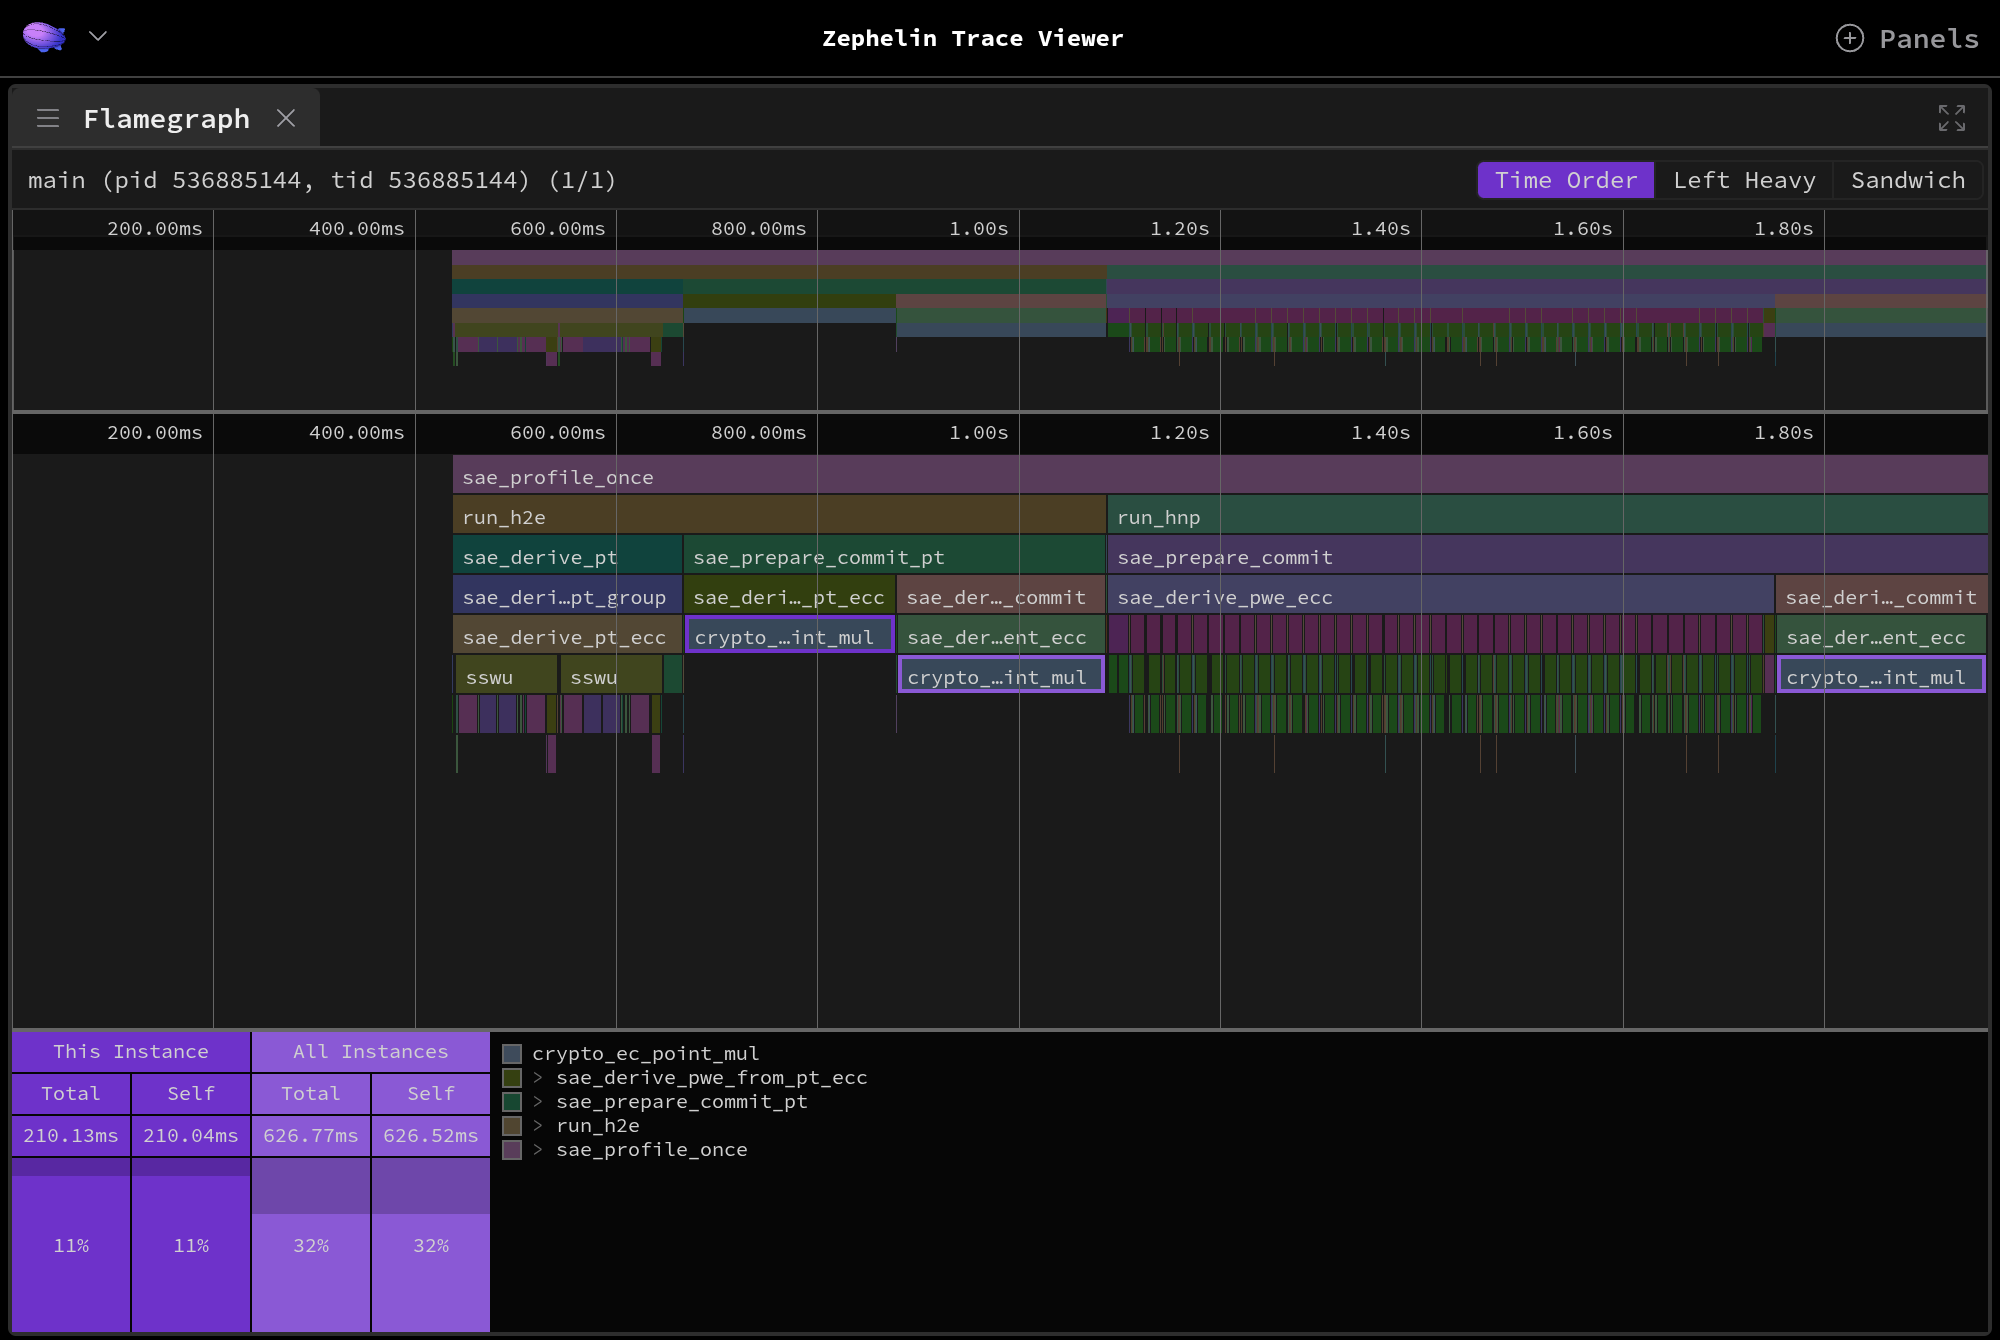
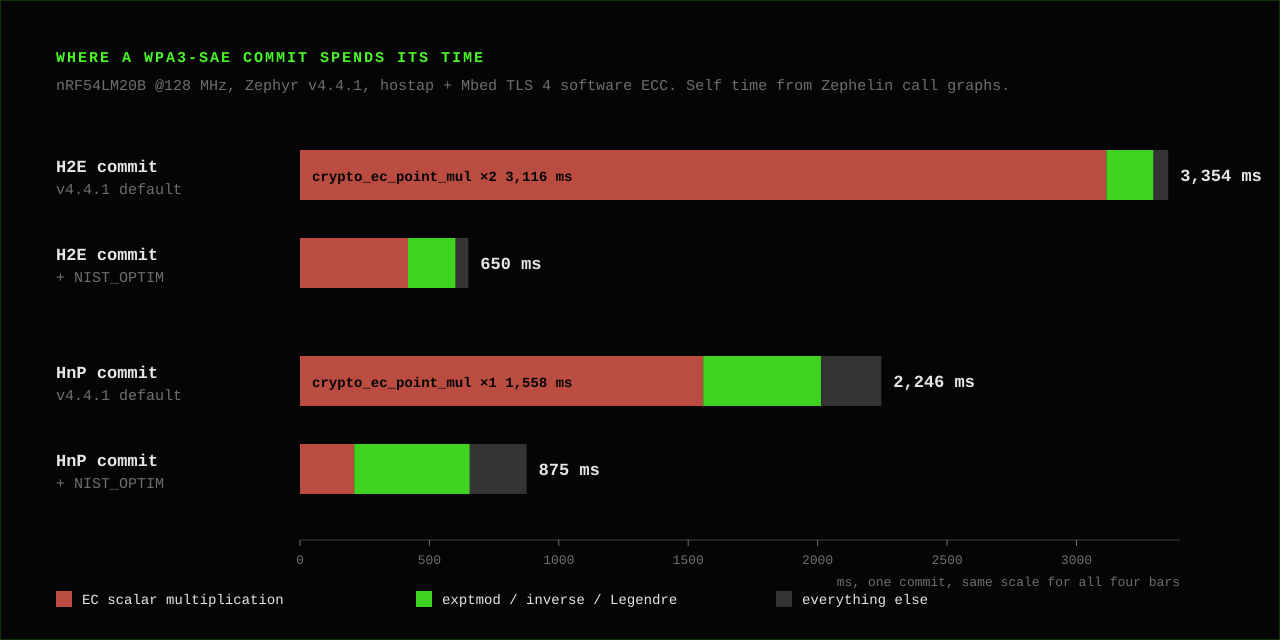
The same three calls now total 627 ms, and the structure that was buried underneath them shows up: the two SSWU map evaluations on the left, and the forty iterations of the Hunting-and-Pecking loop on the right. Summed per function across both commits (each bar is one instrumented run, hence 3,354 ms rather than the 3,332 ms median):
| per call | v4.4.1 default | NIST_OPTIM=y | |
|---|---|---|---|
crypto_ec_point_mul | 1,558 ms | 209 ms | 7.5× |
crypto_bignum_exptmod | 11.2 ms | 11.0 ms | same |
crypto_bignum_legendre | 10.6 ms | 10.4 ms | same |
crypto_bignum_inverse | 17.5 ms | 18.5 ms | same |
That second table is the useful one. A profile that says “crypto is slow” is
not news. A profile that says one operation got 7.5× slower and the
operations sharing the same bignum code didn’t is a diagnosis. Modular
exponentiation, inversion and the Legendre symbol all run on Mbed TLS’s
Montgomery arithmetic. Scalar multiplication is the one that reduces modulo
the curve prime after every field multiplication — and
MBEDTLS_ECP_NIST_OPTIM is the option that swaps the generic reduction for
P-256’s special-form one.
On Zephyr v4.4, when the Mbed TLS / TF-PSA-Crypto configuration moved to
Kconfig — part of the same Mbed TLS 4.x migration
we covered from the Wi-Fi side
— that symbol was declared without a default. Upstream Mbed TLS enables
it in its own config headers; in Zephyr it silently became n. I fixed that
upstream in June
(zephyr#111632),
but it landed after v4.4.1 was cut and was never backported, so the newest
release Zephelin supports still ships the slow path. The backport is now
zephyr#121034,
verified on the same board: the stock v4.4.1 build with it generates an H2E
commit in 649 ms.
Once that’s fixed the profile has a new top line, and it’s worth reading too: on Hunting-and-Pecking, half of the remaining time is 42 Legendre-symbol computations — the quadratic-residue tests inside the hunting loop. H2E doesn’t have a loop, doesn’t do them, and comes out 24% faster: the constant-time option is also the cheap one, now with the cost itemised.
Getting a call graph out of a Cortex-M33
That chart was not the first thing the board gave us. The first thing it gave us was nothing at all — not even a boot banner — with Zephelin’s own sample and its recommended configuration. It took four fixes, and since three of them are in code every Zephyr user shares, they’re worth walking through.
Hooks running before the kernel exists. Zephelin’s patch set makes the
instrumentation on/off state Z_THREAD_LOCAL. But compiler instrumentation
calls its hook from the very first instrumented function, which can be
arch_data_copy() in early boot — before the kernel has set up thread-local
storage. With the TLS pointer still 0, _instr_enabled = true is a store to
absolute address 0x18. On the boards Zephelin is tested on, that address
presumably lands in flash or ROM that ignores the write. On the nRF54L it’s RRAM, and the store
usage-faults before the console comes up. Worse, reads of the same state
return whatever happens to be in the vector table, so whether hooks run during
boot depends on how the TLS section is laid out — an early version of our fix
moved one variable and locked up qemu_cortex_m3 instead. The fix makes the
hooks inert until z_sys_post_kernel is set, read directly rather than
through k_is_pre_kernel(), which is itself an instrumented inline and would
recurse.
Fixing that also exposed that triggers didn’t work: the per-thread “on” flag
started out true, so the trigger function never actually turned recording on,
and whichever thread initialised instrumentation recorded from boot onwards.
With a trigger deeper than main(), the buffer filled with unrelated events
before the code you asked about ran. Recording now starts at the trigger, as
the documentation says.
A hook between two instructions that must be adjacent. With the boot fault
gone, the board died again, this time with Stack overflow on CPU 0 in
main — on a stack that was still painted with 0xAA. Single-stepping
arch_switch_to_main_thread() showed why. It sets PSPLIM, the Armv8-M stack
limit register, to the main thread’s stack with __set_PSPLIM(), then
switches PSP onto that stack. __set_PSPLIM() is an inline CMSIS intrinsic,
and -finstrument-functions instruments inlined copies too: GCC emitted a call
to __cyg_profile_func_exit() between the two, which pushes onto the old boot
stack — now below the new limit — and the core faults. The same class of
problem hit an inlined cmse_TT() from the toolchain’s arm_cmse.h in MPU
setup. This one is not Zephelin’s: stock upstream Zephyr’s
samples/subsys/instrumentation dies the same way on nRF54L. Upstream has no
default exclusion list at all. The fix excludes the CMSIS core headers and
arm_cmse.h on Cortex-M; Zephelin’s example boards are Cortex-M3, M4 and M7,
which have no PSPLIM, which is presumably why nobody hit it.
A 256 KB buffer that holds 1 byte. Everything booted, recorded at full
speed, and dumped an empty trace. The call-graph buffer is a Zephyr
ring_buf, whose indices are 16-bit unless CONFIG_RING_BUFFER_LARGE is set.
The Kconfig for the buffer size accepts up to 4 GiB without selecting it, and
the size check in ring_buf_init() is an __ASSERT — compiled out in a normal
build. Every claim returned 1 byte; no record was ever stored. Upstream has the
same Kconfig. The fix selects RING_BUFFER_LARGE when the buffer needs it and
turns the check into a BUILD_ASSERT.
A link error. Zephelin’s default recursive-exclude list names
sys_clock_isr, which the nRF GRTC timer driver doesn’t define. The generated
references are now weak.
Two further things are worth knowing if you instrument real code, though
neither is a bug. Instrumenting all of Zephyr under an Mbed TLS workload is
impractical: Mbed TLS mallocs and frees on every bignum operation, and with
the heap allocator instrumented a single commit hadn’t finished
after almost seven minutes. And you can’t exclude malloc/calloc/free by file, however
precisely you name malloc.c. They’re GCC builtins, so their declaration
location is <built-in>, and the file-based exclusion never matches. Only
excluding them by function name works. Scoping instrumentation to the
application plus hostap is what produced the chart above.
The upstream fixes are zephyr#121033. The Zephelin side — all four, added to both its v4.3.0 and v4.4.1 patch sets, plus a host-script crash — is antmicro/zephelin#10.
2. Stacks and heaps, sized from data
The SAE harness we started from had been written defensively: “ECC point math is stack-heavy”, so 16 KB of main stack and 64 KB of system heap. Zephelin’s memory profiler, checked against ground truth the app prints at the end:
| region | Zephelin reported | true peak | configured |
|---|---|---|---|
| main stack | 3,920 B | 3,936 B | 16,384 B |
| libc heap (Mbed TLS bignums) | 2,760 B | 3,144 B | rest of RAM |
system k_heap | 1,104 B | — | 65,536 B |
Two different kinds of number are hiding in that table. The stack figures are
high-water marks — Zephelin reads them from the painted stack via
k_thread_stack_space_get() — and they agree with ground truth to 16 bytes.
The heap figures are samples: every interval, Zephelin reports the
current allocated_bytes, not max_allocated_bytes, so a peak that comes and
goes between two samples is invisible. Here it under-reported by 12%. That’s
fine for spotting a leak and not fine for sizing a heap.
Either way, the harness was carrying about 75 KB of RAM it never used — 12 KB of main stack and almost the whole 64 KB system heap, because Mbed TLS allocates from libc’s heap, not Zephyr’s. The caveat that matters: this is the commit-generation path only. A real supplicant thread with a live connection needs its own measurement, and that’s exactly what the profiler is for.
3. What it costs to watch
Every number above came from a board that was being observed, so the last question is how much observing changes the answer. Same SAE binary, one Zephelin feature at a time, cycle counts read from the trace:
| configuration | H2E | HnP | flash |
|---|---|---|---|
| baseline, no Zephelin | 3,332 ms | 2,174 ms | 338.1 KB |
| tracing only | ±0% | ±0% | +2.1 KB |
| tracing + CPU load every 500 ms | +1.2% | +1.2% | |
| tracing + memory every 1 s | +6.4% | +6.1% | |
| tracing + memory every 100 ms, 115200 baud | +37.6% | +38.6% | |
| tracing + memory + CPU load, 115200 baud | +42.9% | +44.1% | +3.6 KB |
| tracing + memory every 100 ms, 1 Mbaud | +9.9% | +10.9% | |
| call graph, app + hostap scope | ≈+1% | ≈+3% | +72 KB |
The memory profiler’s cost scales exactly with its sample rate, and a 9× faster UART cuts it from 38% to 10%. That points at the transport, not the profiling: each sample is about thirteen 30-byte events, and with synchronous tracing at 115200 baud the CPU sits in a UART poll loop for ~35 ms out of every 100. Which brings back the priority problem from earlier — asynchronous tracing would hide that cost, except that the tracing thread can’t run while SAE hogs the CPU, so the buffer overflows. On this workload you choose between losing events and paying for them. A faster link (1 Mbaud works fine on the DK, and Zephelin also has USB and debugger backends) is the real fix.
Call-graph instrumentation, by contrast, records into a RAM buffer and dumps afterwards, so the link costs nothing during the run. Scoped to the application and hostap, it moved H2E by about 1% — within run-to-run noise — and Hunting-and-Pecking by about 3%, the price of instrumenting a hot loop. The flash cost is real, though: +72 KB for the hooks at that scope, and +184 KB (+55%) with all of Zephyr instrumented, before the 256 KB buffer. Instrument what you’re asking about, not everything you can.
Worth it?
Yes, with eyes open. Once it works, Zephelin gives you function-level call graphs from real silicon with nothing attached but a UART, memory high-water marks you can trust, and an Apache-2.0 tool chain — the scoped call graph above cost about 1% at runtime and answered a question that wall-clock timing alone had only hinted at. On a Nordic part today it also means a patched kernel, four fixes that aren’t merged yet, an instrumentation scope you have to think about, and transport costs that can move a timing measurement by 40% if you don’t check. SEGGER SystemView, which already streams over RTT on the same J-Link, is still the faster path to a thread timeline. Zephelin’s call graphs are the part it doesn’t have.
The more general lesson is the second table in section 1. The SAE slowdown was visible as a number for months to anyone who ran the code; what made it fixable was an instrument that showed which operation changed and which didn’t.
Caveats
One board: nRF54LM20B, Cortex-M33 at 128 MHz, Zephyr v4.4.1 with Zephelin’s patches, Zephyr SDK 1.0.0, software Mbed TLS 4 / TF-PSA-Crypto ECC — no CRACEN hardware acceleration, which upstream Zephyr doesn’t use for this path. Call-graph timings are single instrumented runs; the headline timings are medians of five uninstrumented runs, and builds differing only in unrelated code moved by up to ±3% from layout effects, so no overhead figure under a few percent should be read as exact. The SAE path is commit generation called directly, not a full handshake over the air.
At Dotstar Systems we work across Zephyr, the wireless stack and the crypto underneath it — and, as here, on making the tools work on the silicon you actually ship. If your firmware is slower than it should be and nobody can say why, or you’d like stacks and heaps sized from data before a product goes out, that’s the kind of problem we like.
References
- Antmicro, “Zephelin and Trace Viewer 1.0 release,” September 2026. Source: https://github.com/antmicro/zephelin
- Dotstar Systems, “Constant-time isn’t enough: why WPA3-SAE had to abandon Hunting-and-Pecking for Hash-to-Element,” 2026 — why H2E is the one to use.
- zephyrproject-rtos/zephyr#111632, “modules: mbedtls: enable MBEDTLS_ECP_NIST_OPTIM by default” — merged for v4.5. https://github.com/zephyrproject-rtos/zephyr/pull/111632
- zephyrproject-rtos/zephyr#121034 — backport of the above to v4.4-branch. https://github.com/zephyrproject-rtos/zephyr/pull/121034
- zephyrproject-rtos/zephyr#121033, “instrumentation: fix call-graph tracing on Armv8-M (nRF54L)” — CMSIS intrinsic exclusion and large trace buffers. https://github.com/zephyrproject-rtos/zephyr/pull/121033
- antmicro/zephelin#10, “Fix instrumentation on Armv8-M (nRF54L) and with large trace buffers.” https://github.com/antmicro/zephelin/pull/10
- GCC manual, “Program Instrumentation Options”
—
-finstrument-functionsand its exclusion lists.
PS: This article, the profiling harness and the fixes were built with AI assistance (Claude Code), including the hands-on part — building, flashing, single-stepping the board and bisecting the faults. The data, the interpretation, and any errors are the author’s.